
ISDA SIMM™ · Initial Margin for Uncleared Derivatives
IM calculated.
Validated. Understood.
Licensed ISDA SIMM™ implementation, every calibration from v2.6 to v2.8+2512, with version-specific validation reports available on request — from Common Risk Interchange Format (CRIF) files or directly from your front-office system. Backtesting and IM forward are early access; historical value at risk (HVaR) benchmarking supports review.
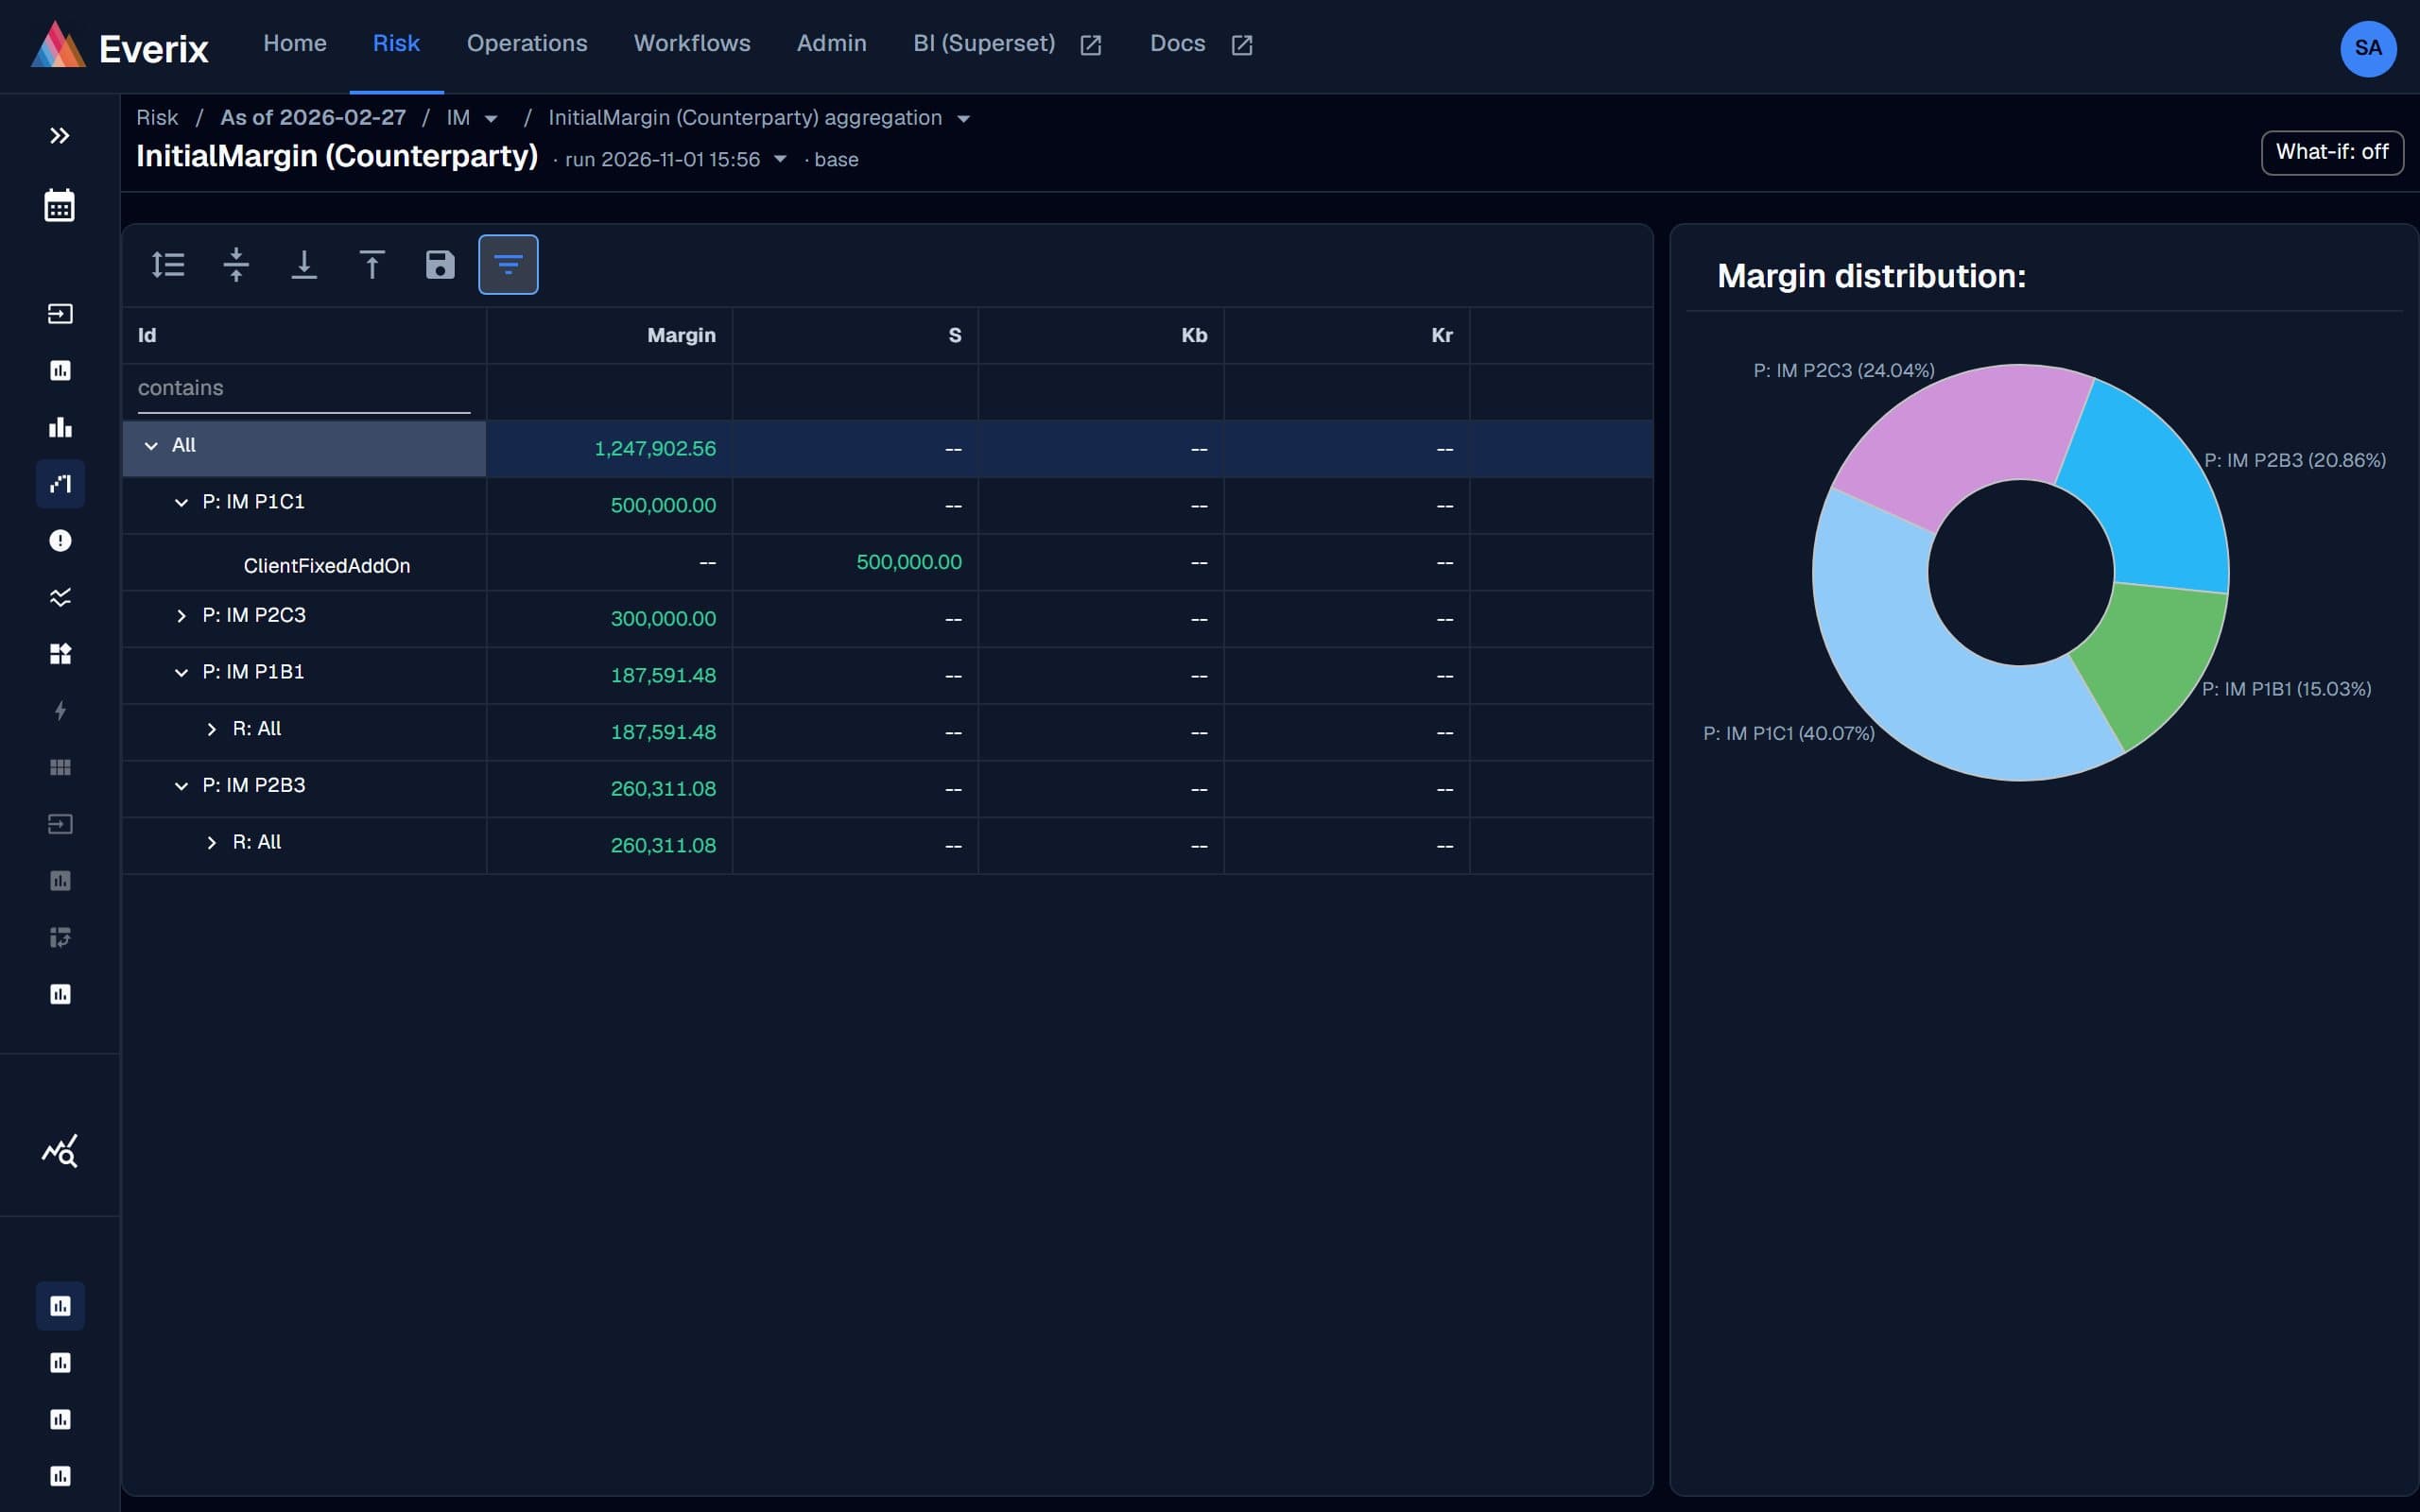
Product screens on this page show synthetic demo data; other figures are illustrative. No client data is shown.
Where you can run it
Compare deployment options| Capability | Everix Cloud IFR | Everix Cloud Risk | Everix Private Cloud | Everix On-site |
|---|---|---|---|---|
| ISDA SIMM™ initial margin | Not offered | On requestScoped with you | On requestAdd-on licence | On requestAdd-on licence |
- Everix Cloud IFR
- Not offered
- Everix Cloud Risk
- On requestScoped with you
- Everix Private Cloud
- On requestAdd-on licence
- Everix On-site
- On requestAdd-on licence
From sensitivities to margin — end to end
Plug in via CRIF files or compute sensitivities directly in Everix. The aggregation engine keeps model updates fast and traceable.
CRIF Integration & Sensitivities
Accept CRIF files from any front-office system or compute sensitivities natively. In-house formats normalised automatically. All intermediary metrics visible — drill down to deal and leg level.
Initial Margin by Risk Class (EUR k)
IM Pledgor & Secured
- AddOn & schedule method
- Pledgor vs secured regulation
- Adjust & validate for auditing
Full SIMM™ Coverage
- Licensed; v2.6/v2.7 validated against ISDA unit tests; request version-specific reports
- Versioned model updates
- Drill down to deal and leg level
Backtesting · Early access
IM and loss monitoring.
Early access
Backtesting compares portfolio-consistent losses over the applicable margin period with model IM, using documented statistical tests and remediation thresholds. The model targets a one-tailed 99% confidence level over at least ten business days, with higher periods where required. One-day P&L alerts below are operational indicators, not standalone SIMM validation results.
More than just IM
Optimise margin costs before you trade. Forecast IM over the trade lifecycle.
Pre-trade Optimisation
- Choose counterparty to minimise new trade IM
- On-the-fly margin cost estimation
- Compare across netting sets
On-the-fly What-if
- Change deal ↔ counterparty
- Incremental IM impact
- Run from Everix or via the API
IM Forward · Early access
- Forecast IM over trade lifetime
- Ageing and maturity effects
- Funding cost of posted IM
IM alongside other risk metrics.
See Initial Margin, XVA, SA-CCR, and liquidity costs in one place. Marginal versions available at any hierarchy level. Export to CSV.
Related modules
XVA
CVA, DVA, FVA and LVA with automatic explain and what-if. MVA from simulated SIMM is in early access.
ExploreSA-CCR
Standardised Approach CCR — marginal, forward, and pre-trade impact. PFE and RC allocation.
ExploreIFR / IFD
EU capital requirements for investment firms — K-factors, own funds, and regulatory reporting.
ExploreSee SIMM™ in your portfolio.
Bring a CRIF to review margin by version, direction and risk class. No paid proof of concept.
Illustrative module dataset, 15 January 2026; amounts in EUR. CVA is shown as a positive cost magnitude (314,397 prior day + 111,960 movement = 426,357). DVA is shown as a negative cost. Exposure, own funds requirements and posted initial margin are separate metrics.